

Loom Monitoring System: Weaving Efficiency, Stops & Energy
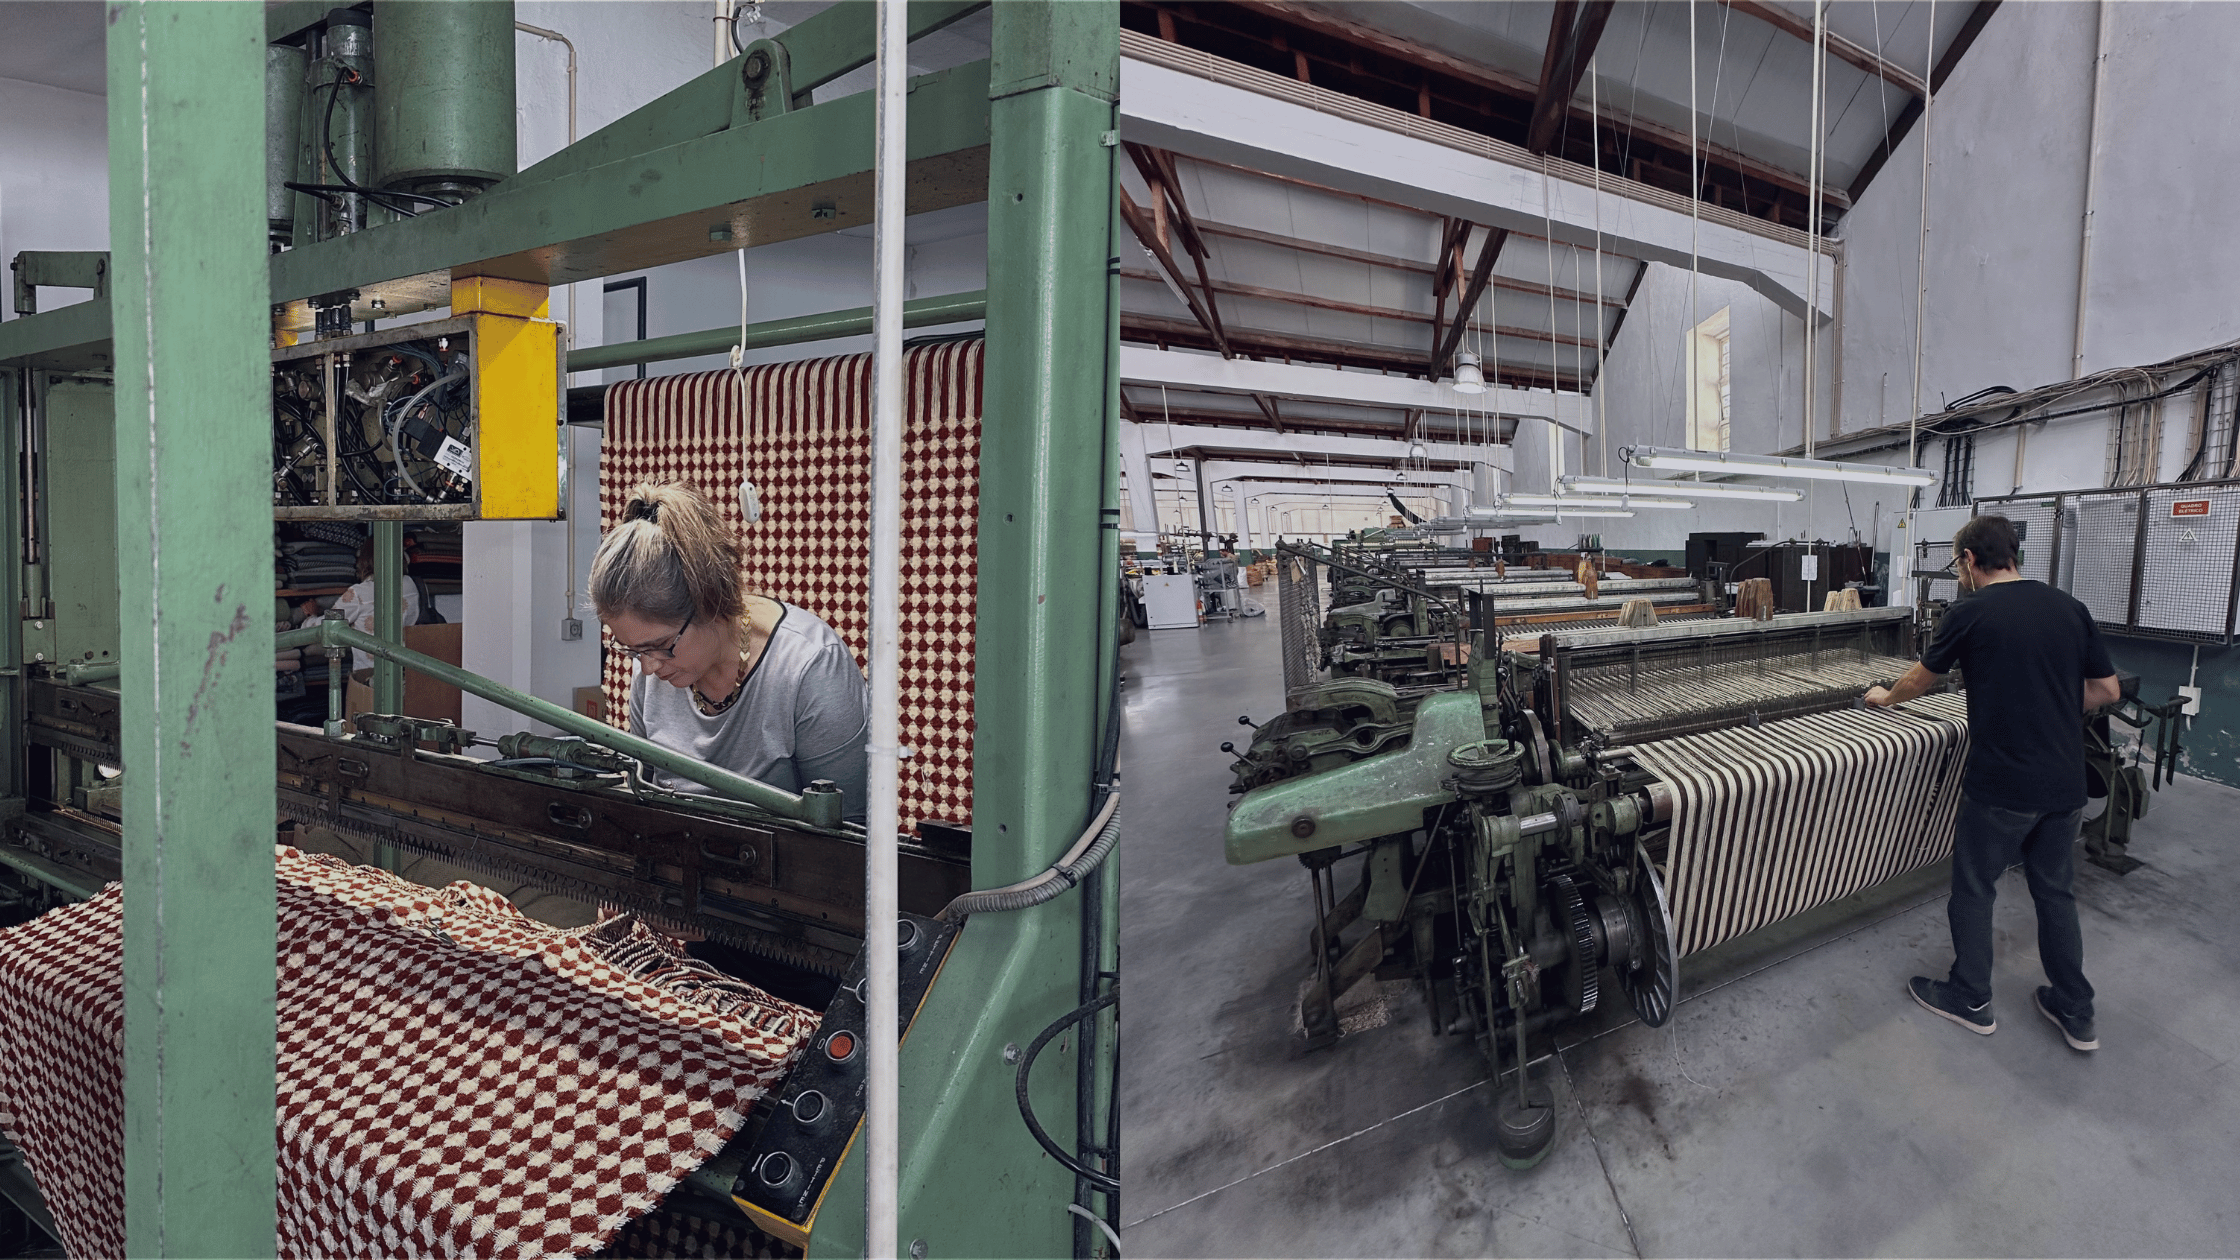
A weaving shed can hold hundreds of looms, each one stopping and restarting many times a shift for broken warp ends, weft faults, and beam changes. A weaver tending a section sees the looms nearest to them, while supervisors and planners see only the fabric that comes off at the end of the shift. A loom monitoring system closes that gap by recording every loom's running time, speed, and stops automatically, so the mill can see its real weaving efficiency by loom, style, and shift and act on the causes while the shift is still running.
The economics of weaving depend on efficiency measured in fractions of a percent across the whole shed. A mill that knows where those points are lost can recover meters of fabric every day from looms it already owns.
What Is a Loom Monitoring System?
A loom monitoring system is a set of sensors, loom connections, and software that automatically records each loom's running and stopped states, speed in picks per minute, pick count, stop causes, and resource use such as electricity and compressed air. It turns every loom into a timestamped record that can be compared across the shed, by style, and by shift.
Modern looms can share speed, pick counts, and stop types from their controllers, while older looms and mixed fleets can be covered with external sensors that read motor current and stop signals directly. A monitoring system should work across air-jet, rapier, projectile, and water-jet looms from different builders, alongside the rest of the textile equipment SensFlo monitors.
How Loom Efficiency Is Measured
Loom efficiency is the ratio of picks actually inserted to the picks the loom could have inserted at its set speed over the same time. A loom set at 700 picks per minute that inserts 588,000 picks in a 1,000-minute period has run at 84 percent efficiency. Because the calculation uses picks, it captures every stop, however short, as well as any time the loom spent running below its set speed.
Efficiency should be read with stop rates. Mills commonly express stops per 100,000 picks, separated into warp stops and weft stops, because the two point to different causes. A rise in warp stops often traces back to sizing, warp preparation, or weave room humidity, while weft stops point toward yarn quality, insertion settings, or, on air-jet looms, air pressure. Tracking both by style shows which fabrics are hardest to weave and where preparation or settings need work.
Planned stops belong in their own category. Beam changes, style changes, and scheduled maintenance are necessary, but recording them separately from unplanned stops keeps them from hiding the warp and weft faults the weavers can reduce. The OEE calculation guide shows how those planned and unplanned losses combine for mills that report OEE.
What Signals Should a Loom Monitoring System Capture?
A loom monitoring system should capture enough data to calculate efficiency, separate stop types, and connect loom performance to the conditions in the weave room. The table below lists the core signals.
SignalWhat it showsHow it is capturedRunning state and stop timeWhen each loom ran and every stop's durationLoom output or a current sensor on the main motorSpeed and pick countPicks per minute, total picks, and efficiencyLoom controller data or a speed sensorStop typeWarp, weft, selvedge, or mechanical stopsLoom stop signals or controller dataCompressed air useAir consumption per loom and per meter on air-jet loomsFlow and pressure sensors on loom air supplyWeave room temperature and humidityConditions that change warp breakage ratesEnvironmental sensors across the shedMotor and drive conditionBearing wear and drive problems before a breakdownVibration and temperature sensors
Compressed air is often the largest energy cost in an air-jet weaving shed, because every pick is inserted with a jet of air. Measuring air flow per loom shows which looms and styles consume the most, reveals leaks, and gives a figure for air per meter of fabric. SensFlo's power monitoring adds the electrical side, including the compressors that supply the shed.
Humidity is the other condition worth monitoring continuously. Warp yarns, especially cotton, break more often when the weave room is too dry, so a drop in humidity often shows up a few hours later as a rise in warp stops across many looms at once. SensFlo's temperature monitoring tracks room conditions alongside the loom data so the connection is visible.
Turning Loom Data Into Higher Efficiency
Loom data raises efficiency when it changes what weavers, fixers, and supervisors do during the shift. Three uses tend to matter most.
The first is response time. A live view of stopped looms, sorted by how long they have been down, helps weavers and fixers reach the longest stops first. Measuring response time by section also shows when a section has more looms than its staff can tend.
The second is style and preparation feedback. Comparing stop rates by style and by warp beam shows when a problem started in warp preparation or sizing, so the fix happens upstream rather than at every loom.
The third is weaver allocation. Efficiency and stop rates by section support fair, data-based decisions on how many looms each weaver can manage for a given style. Automated downtime tracking explains how to capture reasons for long stops without adding paperwork.
How to Monitor Older and Mixed Loom Fleets
Older looms can be monitored with sensors that require no change to the loom controls. A current sensor on the main motor shows running state and stop duration, a speed sensor gives picks per minute, and the loom's existing stop signals can identify warp and weft stops. Flow sensors on air-jet supply lines and vibration sensors on drives add resource and condition data.
Newer looms with networked controllers can add pick counts, styles, and stop codes directly. The guide to legacy machine monitoring connections explains how to choose a path for each loom, and SensFlo's FloControl platform combines sensor signals with OPC UA and Modbus data so every loom reports into one view. Validate a few shifts of monitored picks and stops against loom counters before setting targets.
Why Loom Monitoring Matters for U.S. and Mexican Mills
Textile mills in North America compete on speed, flexibility, and quality more than on labor cost. According to the National Council of Textile Organizations, the U.S. textile supply chain employed 453,122 workers in 2025 and shipped $60.9 billion in textiles and apparel, with much of its trade flowing within the Western Hemisphere. Mills on both sides of the border that supply that market need high loom efficiency and reliable delivery, and the guide to multi-facility machine monitoring shows how to compare sheds across plants.
Weaving is one stage in a longer process. Mills with knitting or spinning operations can apply the same approach through knitting machine monitoring and spinning mill monitoring, and the overview of machine monitoring for textile manufacturing covers the wider mill.
A weaving shed that sees every stop as it happens can run closer to its rated speed with the looms and weavers it already has. Use the SensFlo ROAI calculator to estimate the value of each efficiency point, or schedule a SensFlo demo with a list of your looms, their builders, and the styles you weave most.
Frequently Asked Questions
How is loom efficiency calculated?
Loom efficiency equals the picks actually inserted divided by the picks the loom could insert at its set speed over the same period. For example, a loom set at 700 picks per minute that inserts 588,000 picks in 1,000 minutes runs at 84 percent efficiency. Pick-based efficiency captures every stop and any time spent below set speed.
What causes low loom efficiency?
The most common causes are frequent warp and weft stops, slow response to stops, long beam and style changes, and running below set speed. Warp stops often trace to sizing, warp preparation, or low humidity, while weft stops often trace to yarn quality or insertion settings. Monitoring stop types by style shows which cause dominates.
Can older looms be connected to a monitoring system?
Yes. Current sensors on the main motor, speed sensors, and the loom's existing stop signals provide running state, picks, and stop types without changes to the loom controls. Newer looms can add controller data such as style and stop codes.
Why monitor compressed air on air-jet looms?
Air-jet looms insert each pick with compressed air, which makes air one of the largest operating costs in the shed. Measuring flow per loom shows air use per meter of fabric, highlights the styles and looms that use the most, and reveals leaks.
How does weave room humidity affect loom stops?
Warp yarns, particularly cotton, become more brittle and break more often when the air is too dry. A drop in humidity is often followed by a rise in warp stops across many looms. Monitoring humidity alongside stop rates makes that link visible so conditions can be corrected quickly. The machine monitoring glossary defines related terms.



Talk to us
Let us take your company to the next level. Let’s have a chat and find out how we can help you.

