

Machine Monitoring for Automotive Manufacturing: The Guide to Throughput, Quality, & Delivery
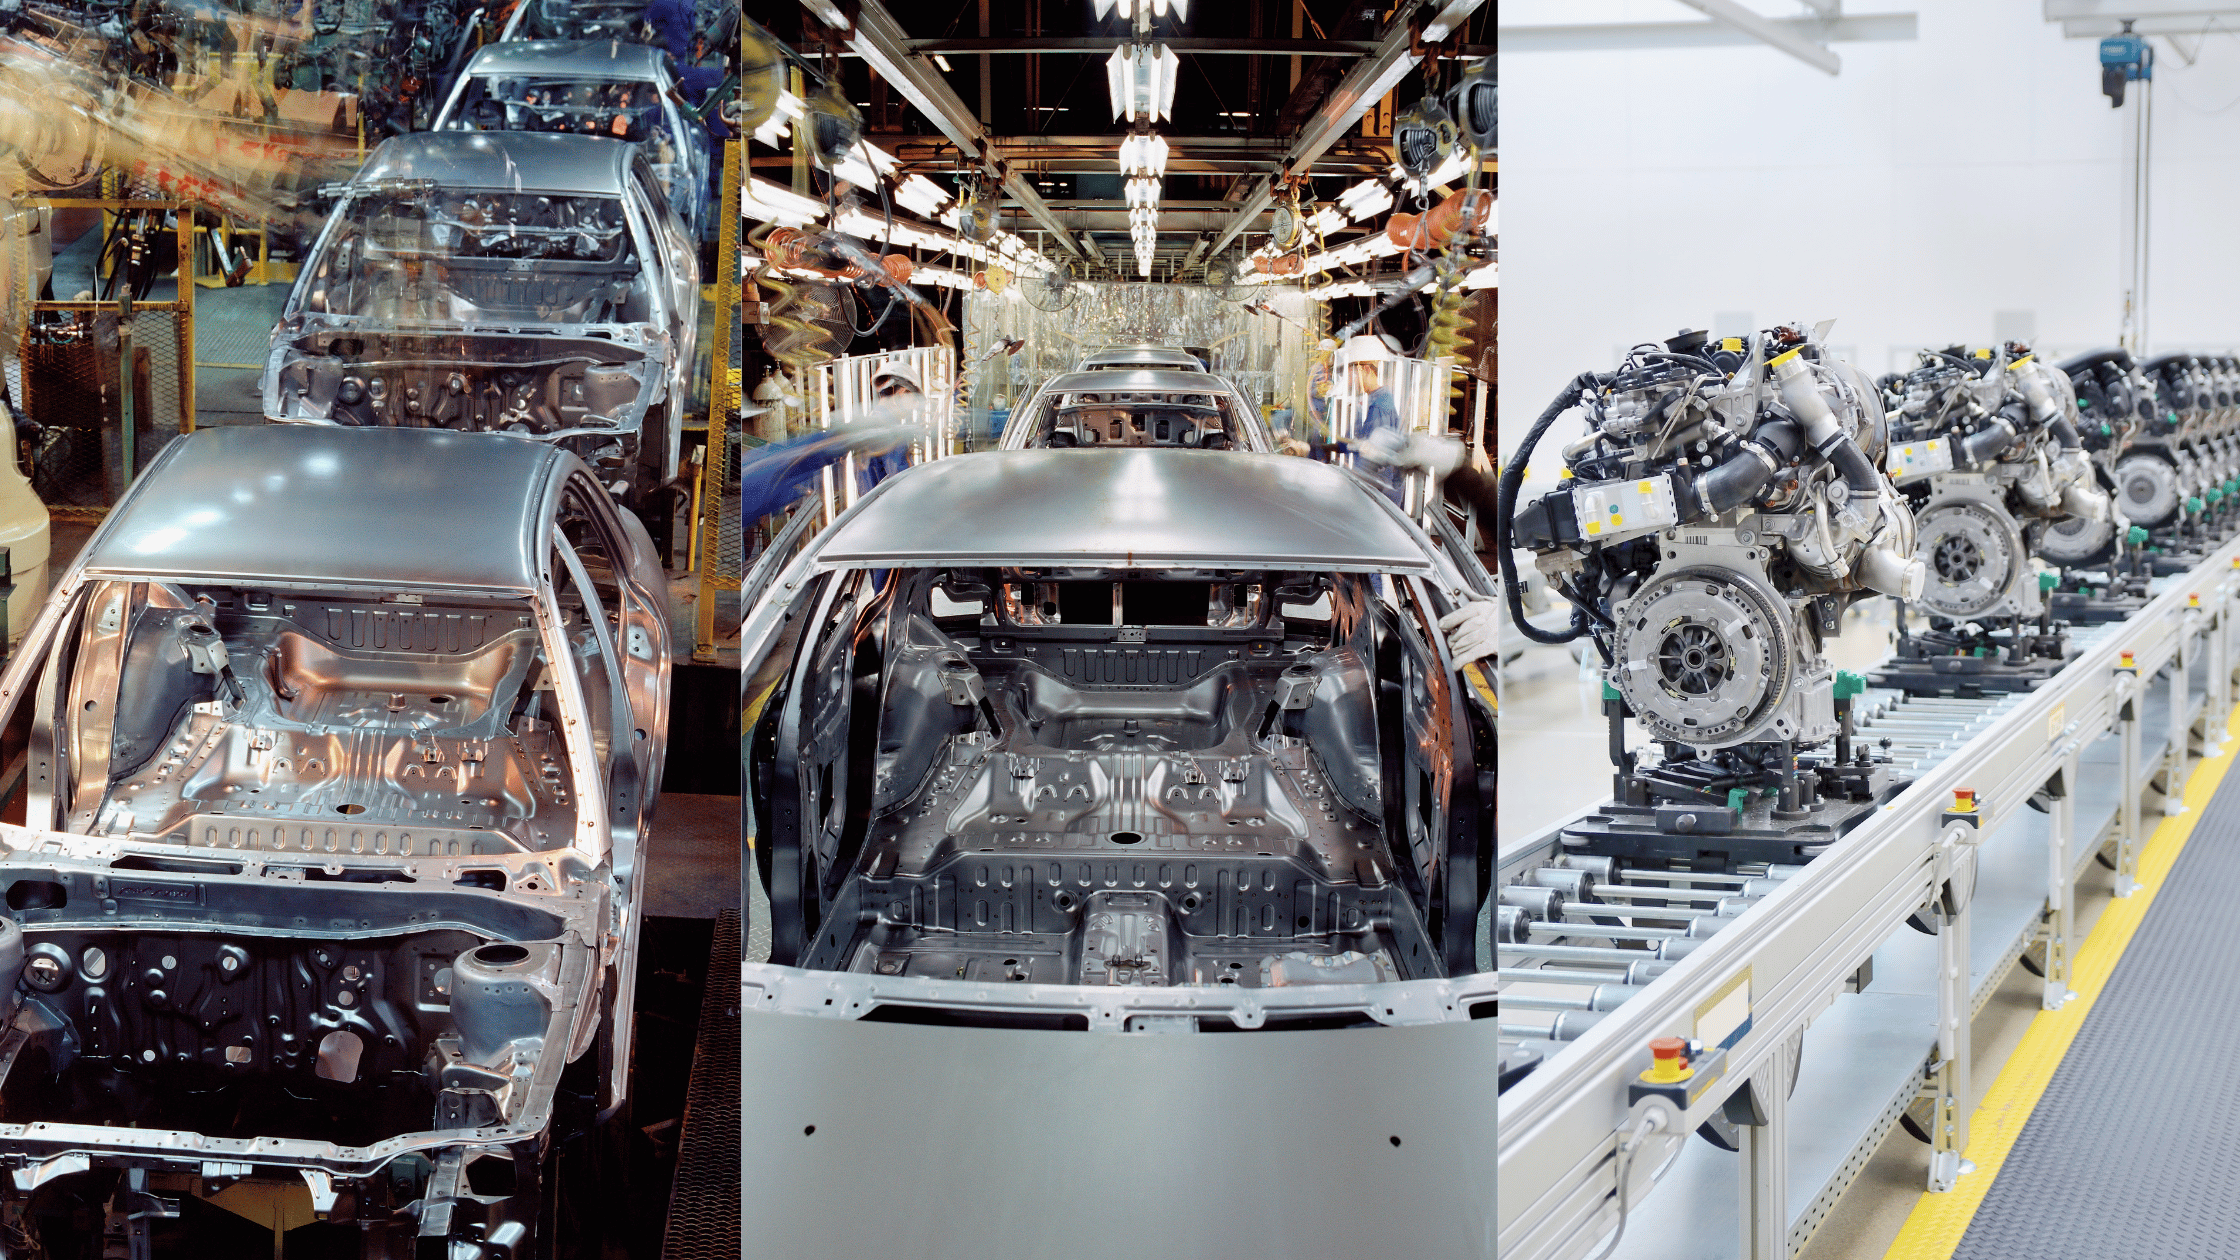
Automotive manufacturing depends on synchronized production. Stamping, casting, machining, molding, welding, painting, assembly, testing, and material movement must stay aligned with takt time and customer schedules. A short interruption at one constrained operation can create lost output across the line and affect delivery commitments downstream.
Automotive manufacturing machine monitoring gives operations, maintenance, quality, and production control teams current visibility into equipment activity and selected process conditions. It can show when a press, machining center, welding cell, molding machine, conveyor, or assembly station is running, idle, stopped, or falling behind its expected cycle.
This guide explains what automotive manufacturers should monitor, how production data supports quality and delivery, where the financial value comes from, and how to implement monitoring across mixed equipment without adding unnecessary complexity.
What is automotive manufacturing machine monitoring?
Automotive manufacturing machine monitoring is the continuous collection and organization of equipment, process, and production data from the machines used to make vehicles and automotive components.
A monitoring system may collect machine status, cycle time, part counts, downtime, line speed, utilization, vibration, temperature, current, power, pressure, force, flow, and other available signals. The exact data depends on the equipment, sensor configuration, controller access, and connected systems.
Current data helps teams respond during the shift. Historical data helps them compare jobs, parts, lines, machines, shifts, and facilities. Together, those views help identify recurring production losses and verify whether corrective action improved the result.
Machine monitoring supports production and quality decisions. It does not replace an approved control plan, inspection method, statistical process control study, maintenance procedure, or customer specific requirement.
Why machine monitoring matters in automotive production
Takt driven production connects every operation
Automotive lines are planned around a required production pace. When a station cycles slowly, stops repeatedly, or waits for material, the loss can move through upstream and downstream operations.
Machine level monitoring makes the timing visible. Teams can compare actual cycle time with takt time, identify the station restricting output, and separate equipment loss from waiting, material, staffing, quality, and changeover causes.
Delivery performance affects customer relationships
Vehicle manufacturers and higher tier suppliers depend on predictable delivery from the supply chain. Production interruptions can lead to overtime, premium freight, schedule changes, and customer escalation.
Earlier visibility gives production control teams more time to respond. Accurate run time, downtime, and throughput data also supports more realistic commitments when customer demand or schedules change.
High volume makes small losses expensive
A few seconds of additional cycle time can create a meaningful production gap across thousands of cycles. Repeated microstops can reduce output even when no single downtime event appears severe.
Monitoring captures the frequency, duration, and location of those losses. This helps teams prioritize improvement based on total effect rather than the visibility of an individual event.
Quality and equipment behavior are connected
Changes in press force, weld cycle behavior, tool condition, temperature, pressure, current, or cycle time may justify investigation before a larger quality issue develops. Production data gives quality and maintenance teams a shared timeline for reviewing what changed and when.
The quality team determines whether a monitored condition affects product conformity and what containment, inspection, or corrective action is required.
What automotive manufacturers should monitor
The most useful monitoring plan starts with a production question. Common examples include:
- Which line or machine is restricting daily output?
- Where is actual cycle time exceeding takt time?
- Which microstops occur most often?
- How much scheduled time is spent running, waiting, changing over, or stopped?
- Which equipment signals changed before a defect or breakdown?
- How much capacity is available for a volume increase or new program?
Machine status and utilization
Run, idle, stopped, setup, fault, and maintenance states show how available production time is being used. Utilization helps teams evaluate existing capacity and identify assets that require additional context or improvement.
Status should be connected with a reason whenever possible. A machine may be idle because of material shortage, blocked downstream flow, quality hold, planned changeover, operator availability, maintenance, or another cause outside the machine itself.
Cycle time, takt time, and throughput
Cycle time measures how long an operation takes. Takt time represents the pace needed to meet customer demand. Throughput shows the actual output produced over a defined period.
Comparing these measurements helps teams identify slow cycles, production drift, bottlenecks, and the effect of line balancing decisions. Trends by part, tool, shift, or machine provide more useful context than a single plantwide average.
Downtime and microstops
Downtime data should capture the start, duration, equipment, and reason for each event. Short recurring stops deserve attention because their cumulative effect may exceed a longer but infrequent breakdown.
The SensFlo machine downtime guide explains how to measure losses, organize causes, prioritize action, and verify the production time recovered.
Equipment condition
Vibration, temperature, current, power, pressure, and other signals can show changes in motors, bearings, pumps, spindles, gearboxes, weld equipment, presses, and supporting utilities. Condition trends help maintenance teams prioritize inspection and planned work based on equipment behavior and production criticality.
Selected process measurements
Force, torque, temperature, pressure, current, voltage, flow, speed, and time may be relevant to specific automotive processes. Monitoring can make those values easier to review alongside machine activity and production events.
The control plan, process risk analysis, customer requirements, engineering specifications, measurement system, and approved procedures determine which characteristics are controlled and how product acceptance is established.
Automotive equipment and processes that can be monitored
Stamping presses and die systems
Stamping operations may monitor press state, stroke count, cycle time, tonnage or force where available, motor current, vibration, lubrication equipment, die change duration, and downtime.
These measurements can help teams identify repeated feed interruptions, die related stops, reduced production speed, extended changeovers, and equipment condition changes. Historical data also supports planning for die maintenance and available press capacity.
Robotic welding cells
Spot, MIG, laser, and other automated welding cells can be monitored for cell status, cycle time, robot waiting, equipment alarms, current, voltage, wire feed behavior, cooling, gas flow, and supporting utility conditions when those signals are available.
Production monitoring can connect cell interruptions with output loss and provide a timeline for engineering review. Weld acceptance remains governed by the approved welding process, inspection requirements, control plan, and customer specifications.
CNC machining and precision finishing
Engine, transmission, driveline, braking, steering, and other precision components often pass through machining, grinding, honing, and washing operations. Useful data may include machine state, spindle activity, cycle time, tool change frequency, spindle load, vibration, temperature, coolant system behavior, and downtime.
The SensFlo metalworking page covers spindle utilization, CNC downtime, tooling, coolant, and production performance in more detail.
Die casting and foundry equipment
Die casting operations may monitor machine state, cycle time, shot count, pressure, temperature, cooling, trim equipment, furnace support systems, and downtime. The selected measurements should reflect the process design and the decisions operations, maintenance, and quality teams need to make.
Connected production history can help relate process interruptions or cycle changes to a defined production period without replacing metallurgical controls or product inspection.
Injection molding and plastics processing
Automotive plastics operations may monitor press status, cycle time, hydraulic or electric drive behavior, barrel and mold temperature, cooling equipment, material handling, changeovers, and unplanned stops.
Visit the SensFlo plastics monitoring page for additional information on injection molding presses, extrusion, auxiliaries, process stability, and material efficiency.
Paint, coating, and surface treatment
Paint and coating lines may depend on conveyor speed, booth conditions, oven temperature, cure time, pumps, fans, filtration, and material delivery systems. Monitoring selected equipment and environmental conditions can provide earlier visibility into interruptions or drift.
Approved process specifications, instruments, sampling frequency, maintenance controls, and inspection methods determine whether a measurement is suitable for formal quality use.
Assembly and end of line testing
Assembly monitoring may include station status, cycle time, blocked and starved conditions, torque tool activity, fastening completion, test equipment availability, conveyor performance, and fault codes.
At end of line testing, equipment availability and test cycle duration can reveal a constraint that limits finished output even when upstream production appears healthy.
Battery and electric vehicle component production
Battery modules, packs, motors, inverters, and charging components introduce additional thermal, electrical, environmental, joining, and test processes. Monitoring may include equipment status, cycle time, temperature, humidity, pressure, force, electrical test duration, and supporting utility conditions.
Safety, product quality, and traceability requirements should be defined by the applicable product, process, customer, and regulatory controls.
How machine monitoring supports IATF 16949 quality systems
IATF 16949 provides automotive quality management system requirements for organizations producing automotive products and service parts. Automotive organizations may also work under customer specific requirements published by participating manufacturers.
Machine and production data can support the quality management system by providing objective information for:
- Equipment performance and maintenance review
- Production process monitoring
- Capacity analysis and delivery performance
- Investigation of nonconforming output
- Corrective action and effectiveness review
- Continual improvement priorities
- Manufacturing process audit evidence
The organization remains responsible for determining how monitoring data is validated, controlled, retained, reviewed, and connected to its quality procedures.
How monitoring fits with APQP, control plans, PPAP, and SPC
The Automotive Industry Action Group quality core tools include Advanced Product Quality Planning, Control Plan, Production Part Approval Process, Failure Mode and Effects Analysis, Measurement Systems Analysis, and Statistical Process Control.
Monitoring can support these workflows when the data is selected and governed appropriately:
- APQP teams can define required production data during process planning and launch.
- Control plans can identify characteristics, methods, frequency, reaction plans, and responsibilities.
- PPAP evidence can use approved records generated through controlled production and measurement processes.
- SPC can evaluate suitable measurement data for stability and variation.
- FMEA teams can use actual equipment and downtime history when reviewing process risk.
Machine state and condition signals can provide helpful context around a quality event. They should not be treated as a substitute for a capable measurement system or an approved product characteristic.
Automotive information security and TISAX considerations
Production systems may contain customer schedules, part numbers, program information, process data, equipment details, and other sensitive information. Automotive manufacturers should classify the data and approve the architecture before connecting machines or sharing information across facilities and suppliers.
TISAX, administered by the ENX Association, provides an assessment and exchange mechanism for information security in the automotive industry. Applicability depends on customer expectations, business relationships, and the information handled by the organization.
A monitoring deployment should define:
- The data collected from each machine and system
- The approved network and system boundary
- User access, authentication, and logging
- Data storage, retention, backup, and recovery
- Remote and mobile access rules
- Supplier, cloud, and integration responsibilities
Information security requirements should be reviewed with the organization’s IT, cybersecurity, quality, legal, and customer teams.
The financial value of automotive machine monitoring
The business case combines recovered production opportunity with lower operating cost. The most credible estimate uses actual machine rates, planned time, demand, contribution margin, downtime, cycle performance, scrap, labor, and maintenance history.
Recover throughput from existing equipment
Reducing recurring stops, slow cycles, waiting, and long changeovers can create additional production time. When customer demand exists, recovered time can support more sellable output and protect delivery performance.
Reduce overtime and premium freight
More stable production reduces the recovery work required after a disruption. The resulting savings may include overtime, weekend production, schedule changes, premium transportation, and administrative coordination.
Limit scrap and containment cost
Earlier detection and a clearer production timeline can reduce the quantity exposed to an equipment or process issue. Potential savings include material, labor, sorting, inspection, rework, disposal, replacement production, and customer response.
Improve quoting and capacity decisions
Actual cycle time, utilization, and downtime data provide a stronger basis for quotes, sourcing decisions, production routing, and capital requests. Leaders can distinguish a genuine equipment capacity need from recoverable production loss.
Estimate the opportunity
The SensFlo ROAI Calculator helps teams estimate the revenue and cost effect of added productive time. Planning estimates should be validated with actual demand, contribution margin, operating constraints, and verified results after implementation.
How FloControl supports automotive manufacturing
FloControl machine monitoring software organizes equipment signals into production information such as run time, idle time, cycle time, throughput, downtime, utilization, and shift performance. SensFlo can support mixed legacy and modern equipment, with available data determined by the deployment configuration.
Automotive teams can use FloControl to answer questions such as:
- Which line or machine is currently limiting output?
- Where are cycles running above takt time?
- Which downtime causes create the greatest production loss?
- How much available capacity exists by line, shift, or facility?
- Which equipment condition changes require maintenance attention?
- How closely is actual production following the customer schedule?
The existing automotive Tier supplier monitoring article provides additional context for supplier production transparency and customer delivery expectations.
Facilities can review SensFlo pricing to compare monitoring, workflow, analytics, reporting, and integration capabilities.
How to implement machine monitoring in an automotive plant
1. Start with the production constraint
Select the press, cell, line, test station, or utility with the greatest effect on throughput, delivery, quality, or operating cost. Define the current loss using available production and financial data.
2. Define the decisions the data must support
Agree on the questions that operations, maintenance, quality, engineering, and production control need to answer. Select signals and reports that directly support those decisions.
3. Align with the quality system
Determine whether monitoring data is operational information, supporting evidence, or a controlled quality record. Involve quality and metrology personnel when data will support a control plan, PPAP, SPC, or product acceptance activity.
4. Approve the data and security architecture
Classify the information, document data flows, define access, and confirm customer or TISAX related requirements before connecting systems.
5. Establish a baseline
Measure normal run time, downtime, cycle time, throughput, utilization, changeover duration, and selected equipment condition data. Account for different products, tools, shifts, and operating modes.
6. Create response workflows
Define who receives an alert, what they should verify, when production or quality should be contained, and how the response is documented. Assign ownership for the recurring losses identified in review meetings.
7. Verify the effect and expand
Compare baseline and post implementation performance. Track recovered production time, throughput, downtime, changeover performance, maintenance response, reporting labor, and verified cost savings. Expand to the next constraint after the first use case has a clear owner and measurable result.
Build automotive monitoring around throughput, quality, and delivery
Automotive manufacturing machine monitoring is most valuable when it connects equipment activity with the decisions that determine production output and customer performance.
Start with a constrained process, define the data and ownership clearly, and measure the financial effect. That approach gives operations, maintenance, and quality teams a shared production record while helping the business protect delivery, capacity, and margin.
Contact SensFlo to review your automotive equipment, production constraints, data requirements, and expected return.
Frequently Asked Questions
What is automotive manufacturing machine monitoring?
Automotive manufacturing machine monitoring continuously collects and organizes equipment, process, and production data from stamping, machining, molding, welding, painting, assembly, testing, and supporting operations. It gives teams current and historical visibility into machine status, cycle time, throughput, downtime, utilization, equipment condition, and selected process measurements.
What equipment can SensFlo monitor in an automotive plant?
SensFlo can monitor equipment such as stamping presses, CNC machines, robotic welding cells, injection molding machines, die casting equipment, conveyors, assembly stations, test systems, pumps, compressors, and other production assets. The exact data depends on the machine, sensors, controller access, and deployment configuration.
How does machine monitoring support IATF 16949?
Machine monitoring can provide objective information for equipment performance, maintenance, process monitoring, capacity analysis, delivery performance, corrective action, and continual improvement. The organization remains responsible for its quality management system, customer specific requirements, record controls, approved methods, and certification. Monitoring software does not provide IATF 16949 certification by itself.
How does machine monitoring fit into an automotive control plan?
A control plan defines the characteristics, methods, frequency, reaction plan, and responsibilities required for the process. Suitable machine or process data may support that plan when the measurement method, data integrity, calibration, validation, and record controls meet the organization’s requirements. Quality and engineering personnel should approve the intended use.
What is the difference between cycle time and takt time?
Cycle time is the time required to complete an operation or produce a unit. Takt time is the production pace required to meet customer demand. Comparing actual cycle time with takt time helps teams identify stations that may restrict line output.
How does monitoring reduce downtime in automotive manufacturing?
Monitoring automatically records stopped, idle, slow, or abnormal equipment conditions while production is running. Teams can respond sooner, compare the total effect of recurring events, and prioritize maintenance or process changes. Read the SensFlo downtime reduction guide for the complete improvement framework.
Can machine monitoring help automotive manufacturers reduce scrap?
Monitoring can help teams identify changes in equipment behavior or selected process conditions and connect those events with a defined production period. Earlier investigation may limit the quantity exposed to an issue. Product conformity and containment decisions remain governed by the control plan, inspection methods, customer requirements, and quality system.
How is automotive machine monitoring ROI calculated?
Return may include recovered productive time, additional sellable output, reduced overtime, lower premium freight, less scrap and rework, lower maintenance expense, reduced reporting labor, and deferred capital spending. Use the SensFlo ROAI Calculator for an initial estimate, then validate it with plant data and verified results.


Talk to us
Let us take your company to the next level. Let’s have a chat and find out how we can help you.

