

How to Reduce Operational Costs in Manufacturing
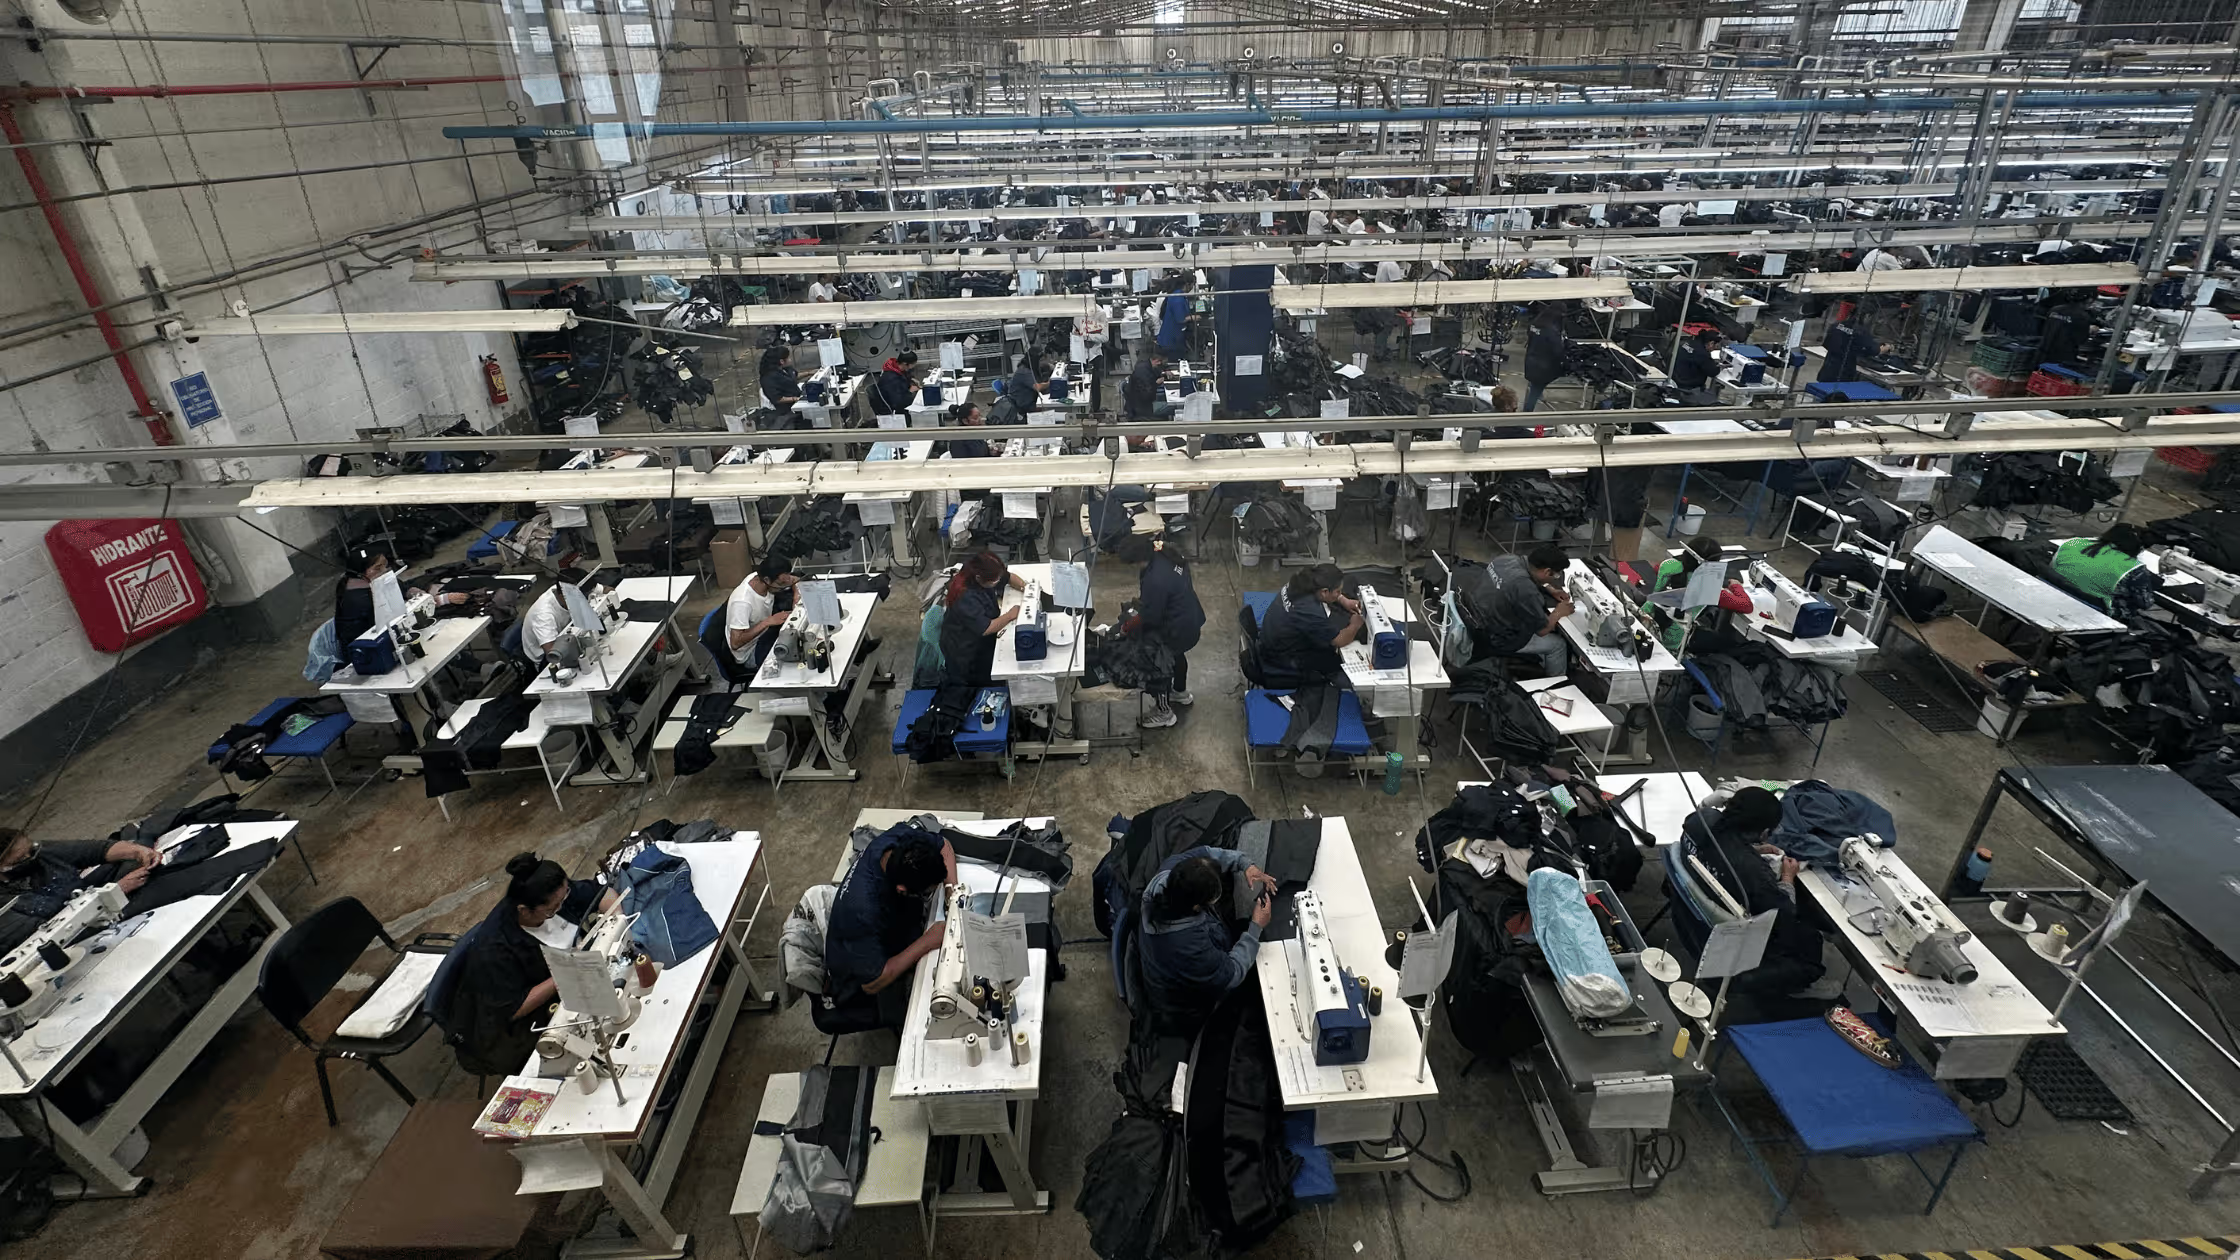
Manufacturers reduce operational costs by improving four measurable production levers: unplanned downtime, scrap and rework, energy waste, and underutilized machine capacity. Each lever affects cost per part, delivery performance, labor efficiency, and margin. The most practical way to reduce these costs is to measure them at the machine level, identify the largest repeatable losses, and act on live production data instead of delayed reports.
Cost reduction in manufacturing is different from general business cost-cutting. A finance team can reduce overhead, renegotiate supplier contracts, or adjust purchasing. Those actions matter, but the largest controllable losses on the plant floor often come from equipment that is not producing, parts that must be scrapped or reworked, energy consumed without output, and machines that have recoverable capacity hidden inside idle time, slow cycles, or poor scheduling visibility.
This guide explains how each cost lever works, which metrics to track, and how real-time machine monitoring helps manufacturers connect daily production behavior to top-line revenue and bottom-line savings.
Summary
The four most important operational cost levers in manufacturing are downtime, scrap and rework, energy waste, and underutilized machine capacity. Downtime increases labor cost, missed shipments, maintenance pressure, and lost revenue opportunity. Scrap and rework consume material, machine time, and labor without producing sellable output. Energy waste increases operating cost when equipment sits powered, idle, or running inefficiently. Underutilized capacity limits output from assets the business already owns. Real time machine data helps teams measure these losses, rank them by impact, and reduce the largest cost drivers first.
Lever 1: Reduce unplanned downtime costs
Unplanned downtime is one of the most visible cost drivers in manufacturing because it stops output while labor, overhead, and delivery pressure continue. Deloitte has reported that unplanned downtime costs industrial manufacturers an estimated 50 billion dollars annually, and poor maintenance strategies can reduce productive capacity by 5 to 20%. Deloitte predictive maintenance resource
Preventing production delays is one of the clearest ways to reduce downtime-related costs because it helps teams catch machine stops, setup overruns, and schedule drift before they turn into overtime, missed shipments, or lost production capacity.
At the plant level, downtime cost is usually larger than the repair cost alone. It can include idle labor, missed production, overtime, late shipments, expedited freight, maintenance disruption, supervisor time, and lost revenue from capacity that could not be used.
A practical downtime cost formula is:
Downtime cost = downtime hours × hourly production value + labor and recovery costs
The first step is not to estimate every possible cost perfectly. The first step is to measure downtime consistently enough to see which machines, shifts, and stoppage causes are creating the largest losses.
What to measure
Track downtime hours, event frequency, event duration, repeat stoppage causes, mean time to repair, and mean time between failures. When possible, separate planned downtime from unplanned downtime so maintenance and production teams are not treating setup, cleaning, planned service, and surprise breakdowns as the same type of loss.
How real-time machine data helps
Real-time machine monitoring shows when a machine stops, how long it stays stopped, and whether the event repeats across machines, shifts, or part types. FloControl converts raw machine signals into production data such as utilization, downtime, cycle time, and shift performance, updated continuously. This gives teams a clearer view of what is stopped, what is running, and where production time is being lost.
For manufacturers that currently rely on operator logs or supervisor walkarounds, this matters because downtime often gets rounded, missed, or logged after the details are no longer fresh. A live view gives the team a better chance to respond during the shift and prevent the same issue from recurring.
Cost reduction actions
Start by ranking downtime causes by total lost time, not just frequency. A frequent two-minute stop and a less frequent one-hour stop may require different responses. Assign ownership to the largest recurring cause, define the corrective action, and review whether downtime decreased after the fix.
If a machine begins showing more frequent stoppages, slower cycles, or abnormal behavior before a failure, connect that pattern to predictive maintenance work. That helps maintenance teams act before a small warning sign becomes a larger production interruption.
Lever 2: Lower scrap and rework costs
Scrap and rework reduce profitability because they consume material, labor, machine time, inspection time, and capacity without creating full value. Scrap is the cost of product that cannot be sold. Rework is the cost of correcting product that did not meet requirements the first time.
The financial impact is often larger than the defective part alone. Scrap may also create schedule disruption, extra material demand, missed delivery timing, quality investigation time, and margin loss. Rework may keep machines and employees busy while no new sellable output is being produced.
A practical scrap cost formula is:
Scrap cost = scrapped units × material cost per unit + machine time + labor and handling cost
A practical rework cost formula is:
Rework cost = rework hours × labor rate + machine time + inspection and handling cost
What to measure
Track scrap rate, first pass yield, reject reasons, rework hours, defect rate by machine, defect rate by shift, startup scrap, and quality losses after changeovers. When possible, connect quality losses to the machine state and production context around the event.
For example, a higher reject rate after setup may point to startup stabilization issues. A defect pattern during a specific shift may point to training, inspection, tooling, material, or environmental differences. A scrap spike after a period of unstable cycle time may point to process drift.
How real-time machine data helps
Machine data helps quality teams see what was happening before and during a defect pattern. Cycle time changes, repeated stops, long idle periods, setup overruns, and reduced speed may all provide clues. When those signals are connected to production output and reject context, the team can move from general quality concern to a more specific root cause investigation.
For plastics manufacturers, this can include cycle time, mold changeover behavior, unplanned stops, utilization, planned versus actuals, and downtime reasons. For metalworking manufacturers, this can include spindle time, cycle performance, unplanned downtime, verified machine availability, and downtime categorization.
Cost reduction actions
Review scrap and rework by machine, shift, part, setup, and production condition. Look for repeatable patterns. If scrap rises after changeovers, focus on setup stability. If scrap rises with longer cycle times, review process drift. If rework increases during certain shifts, review work instructions, training, inspection timing, and machine condition.
The goal is to reduce the cost of poor quality before it compounds into labor waste, material waste, and missed delivery commitments.
Lever 3: Cut energy waste from idle and inefficient equipment
Energy waste is often treated separately from production performance, but the two are connected. A machine that is powered, idle, waiting, or running inefficiently may still consume energy while producing little or no sellable output. The cost may not always show up in a machine-level report, but it shows up in facility operating expense.
The U.S. Energy Information Administration states that the Manufacturing Energy Consumption Survey is the only national source for estimates of energy-related characteristics, consumption, and expenditures for U.S. manufacturers. Preliminary 2022 MECS results showed total U.S. manufacturing energy consumption increased 6% between 2018 and 2022. U.S. EIA Manufacturing Energy Consumption Survey
For this guide, energy waste should be understood as a production behavior problem first. The key question is not only how much energy the plant uses. It is how much energy is tied to productive output versus avoidable idle time, inefficient run behavior, and unnecessary machine downtime.
What to measure
Track idle time, nonproductive run time, long waits between jobs, machines powered during extended inactivity, inefficient cycle patterns, and equipment behavior that separates energy use from sellable output. If the facility has energy meters or machine-level energy data, connect those readings to production state. If not, machine state data still helps identify where energy may be consumed without output.
A practical way to frame the issue is:
Energy cost per productive hour = energy cost ÷ productive machine hours
If productive hours rise while total energy stays stable, the energy cost per productive hour improves. If machines sit powered but idle for long periods, the energy cost per productive hour worsens.
How real-time machine data helps
FloControl should not be described as a direct energy meter unless that is part of a specific implementation. The accurate framing is that machine state visibility helps teams distinguish productive time from nonproductive time. If a machine is idle, waiting, stopped, or running below expected rate, the facility may be spending energy without getting the expected output.
By tracking utilization, downtime, cycle time, and shift performance, teams can identify machines that are powered or scheduled but not producing effectively. That gives operations leaders a starting point for reducing idle behavior, improving scheduling, and aligning equipment use with actual demand.
Cost reduction actions
Start with machines that have high idle time, long waits between jobs, or low productive hours relative to scheduled time. Review whether the issue is scheduling, material availability, setup delay, labor availability, maintenance, or process flow. Then decide whether the machine should be rescheduled, shut down during extended inactivity, moved into a different production sequence, or supported with a process change.
Energy cost reduction does not require guessing. It starts with separating productive machine time from nonproductive machine time.
Lever 4: Recover underutilized machine capacity
Underutilized capacity is one of the most expensive hidden costs in manufacturing because the business has already paid for the machine, space, labor support, tooling, maintenance, and overhead. When a machine is not producing at its practical capacity, the facility is leaving output and revenue opportunity unused.
This is where OEE and utilization become important. Lean Enterprise Institute defines OEE as Availability Rate × Performance Rate × Quality Rate. Availability measures downtime losses, Performance measures speed losses, and Quality measures losses from scrap and rework. Lean Enterprise Institute OEE definition
Lean Production notes that 100% OEE means perfect production, with only good parts produced as fast as possible and no stop time. It also describes 85% OEE as a world-class benchmark for discrete manufacturers, while 60% is fairly typical and shows substantial room for improvement. Lean Production OEE resource
The point is not that every shop should chase the same benchmark. The point is that OEE and utilization help manufacturers see how much usable capacity is available inside existing operations.
What to measure
Track machine utilization, productive hours, spindle hours where relevant, OEE, cycle time, planned versus actual output, idle time, downtime, setup time, and shift performance. Compare actual performance to the assumptions used in scheduling, quoting, and capacity planning.
The cost of underutilized capacity can be framed as:
Lost capacity value = available production hours not used × hourly production value
This is especially important when a manufacturer is considering new equipment. If the existing equipment base has recoverable capacity, the better first move may be to improve visibility, scheduling, maintenance response, and cycle consistency before committing capital to another machine.
How real-time machine data helps
SensFlo’s site states that sensors can attach to machines in under 60 seconds with no wiring, no control system access, and no production interruption. FloControl organizes raw machine signals into production data such as utilization, downtime, cycle time, and shift performance. This gives teams a current view of machine behavior instead of relying only on manual reports or assumed capacity.
Published SensFlo results show how recovered utilization can affect output. Axxis Corporation increased machine utilization by 20% within one month and added daily automated reports for shop transparency. True Precision Machining achieved a 35% increase in spindle hours with zero staff or machine increase. Sharp Plastics increased production hours per machine by 20% and reduced idle time by 88%.
Cost reduction actions
Start with the machines that are most important to revenue, delivery performance, or constraint management. Compare scheduled time against productive time. Identify whether lost capacity is coming from downtime, setup delays, slow cycles, idle time, staffing gaps, maintenance patterns, or poor job sequencing.
Then build the improvement plan around the largest capacity gap. If the largest loss is idle time, address scheduling and job readiness. If the largest loss is downtime, address maintenance and repeat stoppages. If the largest loss is cycle time, review process conditions and tooling. If the largest loss is quality, address scrap and rework.
How the four levers work together
These four cost drivers often overlap. A machine that stops repeatedly may also create scrap during restart. A line that runs below expected cycle time may consume more energy per good part. A machine with high idle time may create a scheduling gap that leads to overtime on another shift. A quality issue may consume capacity that could have been used for new production.
That is why operational cost reduction should not be managed as four disconnected projects. The better approach is to create a shared machine data baseline that shows how time, speed, output, and losses connect.
A monitoring-first approach to cost reduction
A monitoring first approach starts with visibility before major process changes. The goal is to measure current conditions, identify the largest losses, and act where the financial impact is clearest.
Step 1: Select the cost driver that matters most
Choose the cost driver that is creating the most pressure right now. For some manufacturers, that will be downtime. For others, it will be scrap, energy waste, or underused capacity.
Step 2: Pick the machines that influence that cost driver
Start with machines that affect delivery, revenue, margin, or bottleneck flow. A small improvement on a constraint machine can be more valuable than a larger improvement on a noncritical asset.
Step 3: Capture live machine status and production behavior
Use machine data to track whether each asset is running, idle, stopped, producing slowly, or losing time during setup. FloControl gives teams visibility into utilization, downtime, cycle time, and shift performance.
Step 4: Compare planned output to actual output
Operational cost often appears when the schedule assumes one level of output and the floor produces another. Planned versus actual visibility helps teams find the gap before it becomes a delivery problem, overtime issue, or margin hit.
Step 5: Rank losses by financial impact
Do not treat every loss equally. A repeated minor stop on the bottleneck machine may matter more than a longer stop on a machine with spare capacity. Rank losses by time, frequency, customer impact, and cost.
Step 6: Assign ownership and review progress
Every improvement action should have an owner, a target, and a review date. If the issue is downtime, maintenance may own the action. If the issue is setup delay, production may own it. If the issue is scrap, quality and operations may share ownership.
Step 7: Calculate the revenue and savings impact
Use recovered production time, improved utilization, lower scrap, reduced overtime, or better throughput to estimate the financial value of the change. The ROAI Calculator can help estimate revenue gains, break even timing, and ROI from reducing cycle time or increasing production output.
Example: Turning hidden capacity into financial impact
A 10-machine facility runs 5 days per week, 50 weeks per year. If each machine recovers 20 minutes of productive time per day, that equals 2,500 additional productive machine hours per year.
The math is simple:
10 machines × 20 minutes per day = 200 minutes per day
200 minutes ÷ 60 = 3.33 hours per day
3.33 hours × 5 days × 50 weeks = 833 additional productive hours per year
If those recovered hours are on higher-value assets, the revenue or savings impact can be significant. The exact value depends on hourly production value, customer demand, labor model, margin, and whether the facility can sell the additional output. But the principle is the same: operational cost reduction becomes easier to justify when lost time is measured in hours, output, and dollars.
Where SensFlo fits
SensFlo fits operational cost reduction where manufacturers need accurate, current machine data to find hidden losses. The role of FloControl is not to replace the production team’s judgment. It gives the team a clearer source of machine level truth so they can make better decisions about downtime, scheduling, maintenance, utilization, and performance.
FloControl converts raw machine signals into organized production data, including utilization, downtime, cycle time, and shift performance. It helps teams see where capacity is being lost, how production conditions change during the shift, and which machines deserve attention first.
For manufacturers trying to reduce operational costs, that data can support four practical outcomes:
- Less downtime through faster detection and better loss visibility.
- Lower scrap and rework through better context around process variation.
- Less energy waste by reducing idle and nonproductive machine behavior.
- More usable capacity from existing machines through better utilization and scheduling decisions.
Implementation checklist
Use this checklist to start reducing operational costs with machine data.
- Identify the top three machines that most affect revenue, delivery, or throughput.
- Track downtime hours, downtime frequency, and repeat stoppage causes.
- Track scrap, rework, and reject reasons by machine and shift.
- Track idle time and nonproductive machine behavior that may increase energy cost per good part.
- Track utilization, cycle time, OEE, and planned versus actual output.
- Rank losses by financial impact, not only by frequency.
- Assign an owner to the largest recurring loss.
- Review progress weekly and compare before and after results.
- Use recovered productive time to estimate revenue gain, avoided cost, or payback.
- Expand monitoring after the first improvement cycle shows measurable value.
Frequently Asked Questions
How do manufacturers reduce operational costs?
Manufacturers reduce operational costs by improving the losses that affect production output directly: unplanned downtime, scrap and rework, energy waste, and underutilized capacity. These levers are measurable at the machine level and can be improved with live production data, better maintenance response, stronger scheduling accuracy, and focused process improvement.
What are the most important manufacturing cost drivers?
The most important manufacturing cost drivers are downtime, labor, material waste, energy use, rework, maintenance, and underused equipment. On the plant floor, the most controllable drivers are often unplanned downtime, scrap and rework, nonproductive energy use, and low machine utilization.
How does unplanned downtime increase manufacturing costs?
Unplanned downtime increases manufacturing costs by stopping output while labor, overhead, and delivery commitments continue. It can also create overtime, expedited freight, missed shipments, reactive maintenance costs, and lost revenue opportunity. Downtime tracking helps teams identify the largest repeat stoppage causes and prioritize fixes.
How do scrap and rework affect manufacturing cost?
Scrap and rework increase manufacturing cost because they consume material, labor, machine time, inspection time, and capacity without producing full value. Scrap removes product from sellable output. Rework uses additional resources to correct product that did not meet requirements the first time. Both reduce margin and can disrupt delivery schedules.
How does energy waste affect manufacturing cost?
Energy waste affects manufacturing cost when equipment consumes power without producing sellable output. This can happen when machines sit idle, wait between jobs, run inefficiently, or stay powered during long periods of inactivity. Machine state data helps teams separate productive time from nonproductive time so energy cost can be reviewed against actual output.
How does machine utilization affect cost per part?
Machine utilization affects cost per part because fixed costs are spread across the output a machine produces. When utilization improves, the same equipment, space, and overhead can support more sellable production. When utilization is low, each part carries more hidden cost from idle time, downtime, labor waste, and unused capacity.
What metrics should manufacturers track to reduce operational costs?
Manufacturers should track downtime hours, downtime frequency, MTTR, MTBF, scrap rate, rework hours, first pass yield, idle time, cycle time, utilization, OEE, and planned versus actual output. FloControl helps teams organize machine signals into production data such as utilization, downtime, cycle time, and shift performance.
How does OEE help reduce operational costs?
OEE helps reduce operational costs by showing whether production losses are coming from Availability, Performance, or Quality. Availability captures downtime losses. Performance captures speed losses. Quality captures scrap and rework losses. Improving OEE helps manufacturers recover productive capacity from existing equipment and reduce cost per good part.
Can machine monitoring reduce manufacturing costs?
Yes. Machine monitoring software can reduce manufacturing costs by showing where machines are stopped, idle, running slowly, or producing below expected performance. This helps teams reduce downtime, improve utilization, identify recurring loss patterns, and act on production issues before they become expensive delays.
How does SensFlo help manufacturers reduce operational costs?
SensFlo helps manufacturers reduce operational costs by turning raw machine signals into live production data. FloControl gives teams visibility into utilization, downtime, cycle time, and shift performance so they can find hidden losses, improve scheduling decisions, reduce idle time, and recover capacity from existing machines.



Talk to us
Let us take your company to the next level. Let’s have a chat and find out how we can help you.

